
Dynamic Graphic Mapping of Renovation Sequences
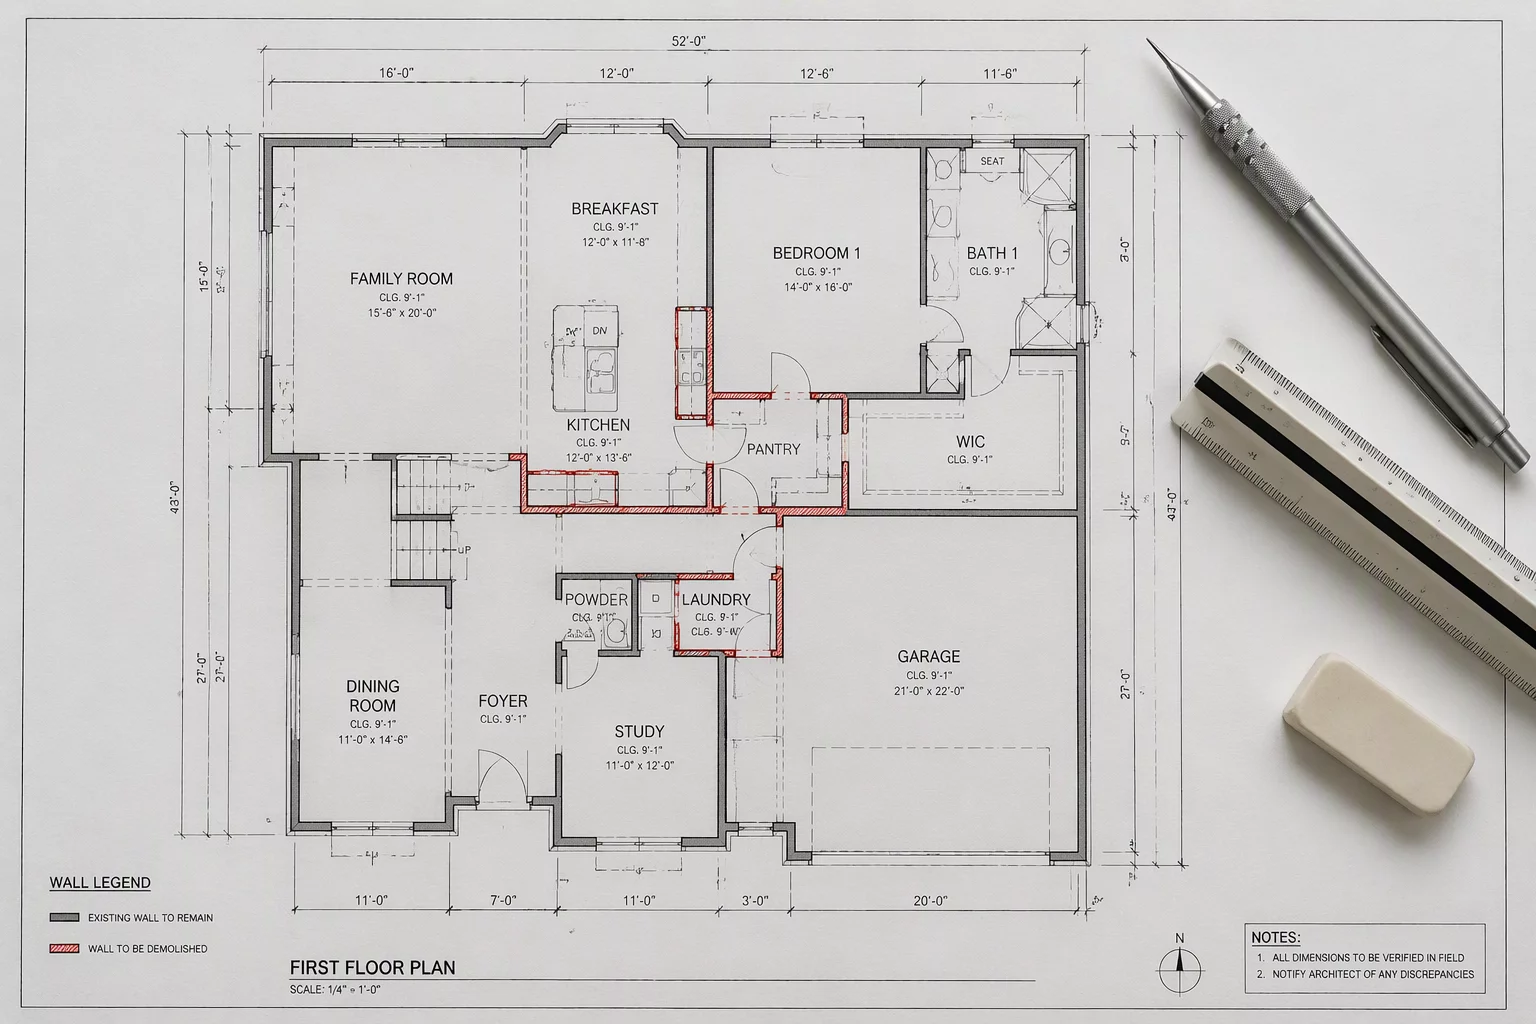
Visualizing phased elements requires an explicit bridge between tabular database properties and spatial model viewports. When project components move through existing, demolition, temporary, and proposed states, standard monochrome views fail to communicate scope boundaries. This protocol establishes rigorous graphic mapping rules, automated legend generation, and dynamic schedule bindings to guarantee zero ambiguity on active construction sites.
01 Principles of Phased Graphic Translation
Data visualization in renovation modeling translates non-geometric lifecycle records into unambiguous visual cues. Each modeled object possesses specific birth, operational, temporary, and retirement milestones. Assigning strict graphic override rules ensures that project managers, quantity surveyors, and field foremen interpret element status identically across drawing packages.
Relying on manual line recoloring introduces immense coordination risks during late design revisions. Automated data visualization links parametric attributes directly to fills, pen styles, surface hatches, and transparency layers, creating self-updating viewport graphics whenever an object phase attribute is altered.
The Single Source Graphic Rule
Graphic attributes must never be applied at the raw element level for phase representation. Every visual override (color fills, line weight changes, and hatch patterns) must derive strictly from global viewport data visualization sets bound to Phase Created and Phase Demolished records.
Pre-Visualization Verification Checklist
- Confirm all record formats contain standardized ISO phase naming syntax before running global visualizer rules.
- Audit wall composite components to verify core and finish boundaries inherit parent phase overrides correctly.
- Validate that nested symbols and group containers pass data visualization queries down to sub-elements.
- Ensure background transparency settings prevent hidden demolition lines from obstructing active phase elements.
04 Frequently Asked Questions
Streamline Your Project Phasing Visualization
Get direct support from our BIM methodologies team to implement custom data visualization templates, automated legends, and graphic override rule sets tailored to your firm.
05 Related Documentation
Assigning Phase Created and Removed
A detailed operational breakdown of assigning accurate lifecycle timestamps to model entities for robust timeline tracking.

Viewports and Phase Visibility
Optimizing viewport configuration settings and class visibility matrices to present phased architectural sets clearly.